TOP CHARTLINK SCANNERS FOR SALE
तुम्हाला माहितीच आहे, शेअर मार्केटमध्ये चांगला स्टॉक शोधायचं किती कठीण काम आहे. एकेक स्टॉक शोधायला, तास तास लागतात. आम्ही एक असे सॉफ्टवेअर टूल देत आहोत कि जे तुमचे हे काम सेकंदात पूर्ण करेल …
चार्टलिंक स्क्रीनर म्हणजे काय ?
१. चार्टलिंक स्क्रीनर हे शेअर बाजारातील संधी शोधण्यासाठीचे एक डिजिटल सॉफ्टवेअर टूल आहे
२. हे वापरकर्त्यांना सुमारे ५००+ निकषांवर आधारित स्टॉक्स फिल्टर करू तूम्हाला देते.
३. यामुळे आपल्या विशिष्ट गरजा किंवा रणनीतींशी जुळणारे स्टॉक्स काही सेकंदात शोधले जातात
४. हे सॉफ्टवेअर तुमचा वेळ वाचवते आणि चांगले गुंतवणूक निर्णय घेण्यास मदत करते.
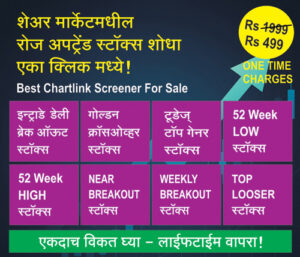
Top Chartlink Screeners : 1) Daily Breakout Stocks, 2) Golden Crossover Stocks, 3) Today’s Top Gainers Stocks, 4) 52 Week Low Stocks, 5) 52 Week High Stocks, 6) Near Breakout Stocks, 7) Weekly Breakout Stocks, 8) Top Loser Stocks
खालील चार्टलिंक स्क्रीनर आपणास मिळणार आहेत
- Daily Breakout Stocks:Identifies stocks breaking through key resistance levels on high volume. This helps catch strong momentum moves early, offering potential entry points for short-term trades.
- Golden Crossover Stocks:Finds stocks where the short-term moving average (e.g., 50-day) crosses above the long-term one (e.g., 200-day). This signals a potential shift from a downtrend to a new uptrend, ideal for swing traders.
- Today’s Top Gainers:Highlights stocks with the strongest price appreciation for the day. This helps track the market’s momentum and identify sectors or stocks in focus, but requires analysis to avoid chasing prices.
- 52 Week Low Stocks:Lists stocks trading at their lowest point in a year. This can help value investors find potentially oversold opportunities for long-term investments, though caution is needed to avoid “value traps.”
- 52 Week High Stocks:Finds stocks hitting new yearly highs. This is a powerful momentum filter, as stocks making new highs often continue to trend upward, offering potential breakout continuation plays.
- Near Breakout Stocks:Pinpoints stocks approaching a key resistance level. This allows traders to prepare watchlists in advance, so they can act quickly when the actual breakout with volume occurs.
- Weekly Breakout:Similar to the daily breakout but on a larger timeframe. These signals are generally more significant and reliable, suitable for swing traders looking for moves that could last several weeks.
- Top Loser Stocks:Shows stocks with the largest price decline for the day. This helps identify weakness, sectors under pressure, or potential short-selling candidates, but also opportunities for oversold bounces.